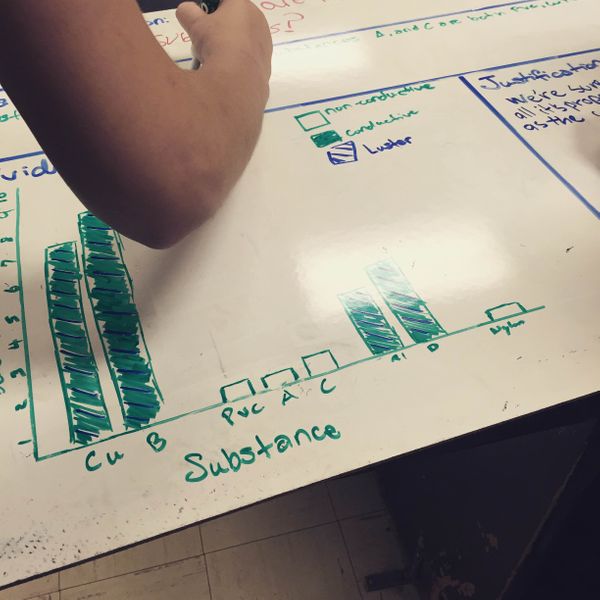
I love when students think of things that the adults don't think of. Here's a group that chose to represent three things (density, luster, conductivity) on one graph, using patterns and colors to represent whether the materials had luster or were conductive, as well as using the bar graph to show the density.
Students were tasked with displaying the data they collected however they chose and this group clearly stood out from the others as a creative and efficient way of doing that. Excellent work!